Correlating Odds Across Platforms Reveals Inefficiencies in Thoroughbred Markets
Written by Leon Butler · Oct 5, 2026
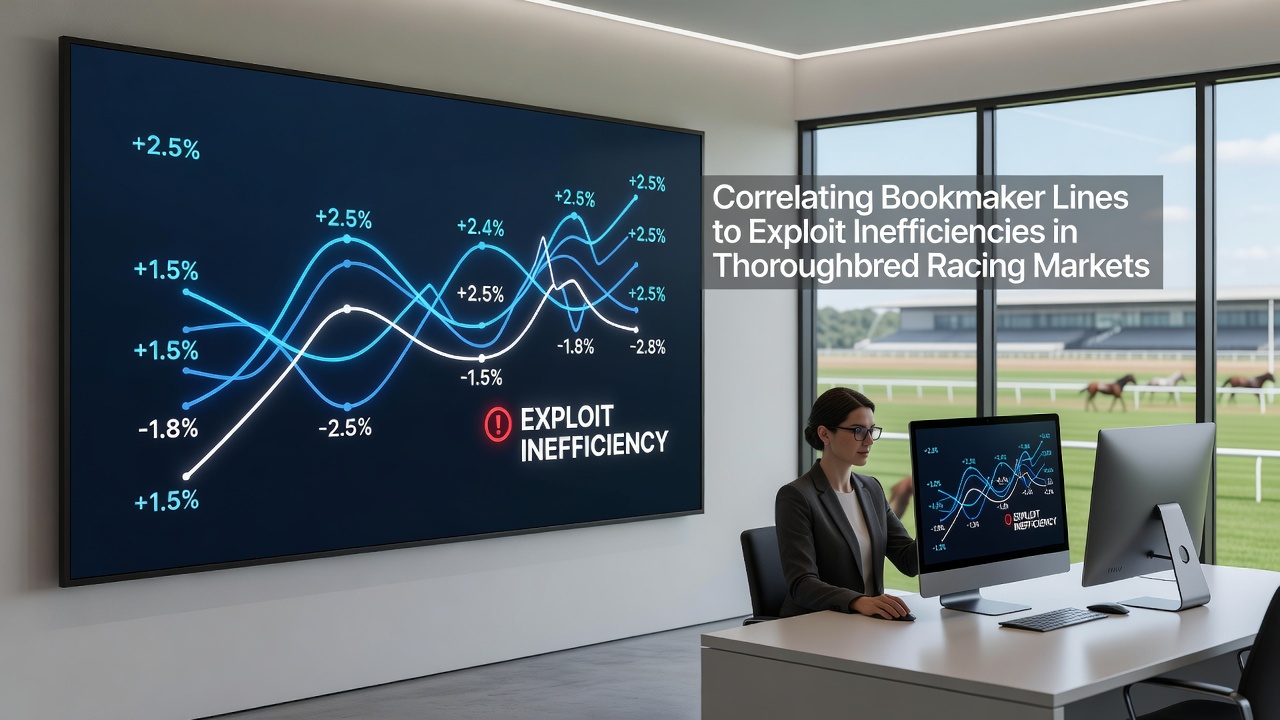
Correlating Odds Across Platforms Reveals Inefficiencies in Thoroughbred Markets
Thoroughbred racing markets generate thousands of individual betting lines each week, and observers note that these lines often diverge across different operators because each bookmaker adjusts odds based on its own liability models, customer profiles, and regional data feeds. Researchers at several academic institutions have tracked these divergences over multiple seasons, finding that systematic comparison of opening and closing prices across platforms can highlight temporary pricing gaps before they close. Data collected from major racing jurisdictions shows that such gaps appear most frequently in races featuring large fields or horses with limited public form, where bookmakers rely on differing proprietary algorithms rather than shared consensus.
How Bookmaker Lines Form and Shift
Operators begin with base prices derived from statistical models that incorporate speed figures, trainer and jockey records, track conditions, and historical payout ratios. As bets arrive, lines move in response to volume on each side, and because each firm maintains separate risk thresholds, the same horse can trade at noticeably different odds at the same moment on competing sites. Studies published in applied economics journals demonstrate that these movements follow measurable patterns: early morning lines tend to widen while late adjustments tighten toward a market average. Those who monitor multiple feeds simultaneously capture instances where one platform lags behind the collective shift, creating a window measured in minutes rather than hours.
Methods for Tracking Line Correlations
Analysts compile time-stamped odds from several licensed operators into spreadsheets or dedicated software that calculates correlation coefficients between pairs of bookmakers. When two lines for the same runner move in close alignment, the coefficient approaches one, yet deviations below a predetermined threshold flag potential mispricing. Industry reports from Australian and North American racing authorities indicate that such deviations occur more often during midweek meetings or when international betting pools are restricted, because fewer sharp accounts are active to correct prices quickly. In October 2026, data released by several North American tracks showed elevated variance in morning lines for maiden claiming races, a category that traditionally attracts lighter professional scrutiny.
Practical Application in Race Analysis
Traders select a target race and pull live prices from at least four operators at fixed intervals beginning two hours before post time. They record each change alongside volume indicators where available, then apply simple regression to identify which bookmaker consistently leads or lags the group. One documented case involved a Grade III event at a major East Coast track where a single operator held its morning line three points longer than competitors; once the line adjusted, the implied probability converged with the rest of the market. Observers note that repeating this process across dozens of races builds a profile of each bookmaker’s adjustment speed, allowing future comparisons to focus on the slowest movers first.

Data Sources and Measurement Tools
Publicly available price feeds from tracks and tote systems provide the raw material, while third-party aggregators supply cleaned historical series for back-testing. A 2025 paper from researchers at the University of Sydney examined closing odds versus final dividends across 12,000 Australian races and reported average discrepancies of 1.8 percent between the highest and lowest quoted prices for the same runner. Those figures align with separate findings issued by the Ontario Lottery and Gaming Corporation, which tracks line movements on its licensed platforms and publishes quarterly summaries of price dispersion. Traders combine these datasets with exchange prices where permitted, creating a fuller picture of where liquidity concentrates and where isolated lines remain vulnerable to slower updates.
Regulatory Context and Market Access
Licensing bodies in multiple jurisdictions require operators to maintain fair and transparent odds, yet rules on how quickly prices must reflect new information vary by region. The Hong Kong Jockey Club publishes detailed movement logs for its pools, offering a benchmark against which private bookmakers elsewhere can be compared. In jurisdictions that permit cross-border access, participants must still comply with local account registration rules, and settlement occurs through each operator’s own system. Figures released in late 2026 by several European gaming associations show steady growth in racing turnover on regulated sites, with the largest share still concentrated in traditional win and place markets rather than exotic wagers.
Conclusion
Correlating bookmaker lines supplies a measurable framework for identifying temporary inefficiencies in thoroughbred markets because price formation remains decentralized across independent operators. Consistent monitoring of opening, mid-day, and closing odds across multiple platforms, supported by historical datasets from racing authorities and academic studies, reveals repeatable patterns in how lines converge. As more granular feeds become available and analytical tools improve, the approach continues to rely on objective comparison rather than subjective judgment of horse ability alone.